Location: Tools Menu
See Also: Supported amino acid abbreviations
The fragmentation modelling tool can be used to predict the potential ions observed when a peptide is fragmented in the collision cell of a tandem mass spectrometer or quadrupole ion trap. In a collision cell, adjustment of various instrumental voltages imparts additional kinetic energy onto ions entering the cell, resulting in fragmentation at certain bonds of the ion.
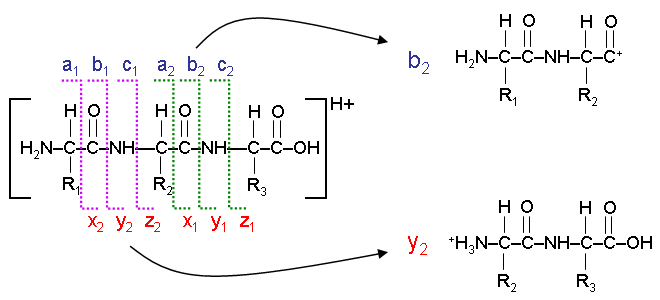
Fragmentation of peptides (amino acid chains) typically occurs along the peptide backbone. Each residue of the peptide chain successively fragments off, both in the N->C and C->N direction. The location that the fragmentation occurs, and the nature of the ion remaining results in various ions, a, b, c and x, y, or z ions. The most commonly observed ions are a, b, and y ions. The following diagram illustrates the formation of b and y ions during the fragmentation of a three residue peptide chain.
The Peptide Sequence Fragmentation Modelling tool can be used to tabulate all of the potential ion fragment masses that could be observed for a given peptide. Optional modifications can be applied, including the loss of an ammonium or hydroxyl ion.
Actual ion data can be imported into the program so that ion matching can be performed. You can import a list of ions to match from a text file by choosing Load List of Ions to Match from the File menu. Alternatively, you can copy the list of ions to the clipboard, then choose Paste List of Ions to Match from the Edit Menu. If the ion list is already visible, you can click on the ion list and press Ctrl+V to paste a new ion list. The format of the ion list should be a list of mass (m/z) and intensity pairs, separated by a space, tab, or comma, with each mass/intensity pair on a separate line. If your software has the ability of deconvoluting the spectrum to transform 2+ and 3+ ions to their 1+ representation, it is advisable that you do this prior to importing the ion list into the Molecular Weight Calculator.
In order to decrease the total number of ions to be matched, the ions being imported can be binned (grouped together) when they are imported. This process involves comparing adjacent ions to see if their m/z difference is below a threshold. If it is, the two (or more) ions are combined to just one ion having an m/z value equal to the average of all the m/z values within tolerance of the given bin. The largest intensity of the combined ions is used for the intensity of the binned ion. The following table illustrates a small portion of an ion list before and after binning. Note that if the average spacing between the m/z values of the ions in the list you import is less than 0.2 Da, then binning of the ions to 0.5 Da is automatically enabled. You may manually enable binning, along with setting the binning parameters using the Ion Match List Options window.
| Original Data | After Binning (Window = 0.5 Da) | ||||||||||
|---|---|---|---|---|---|---|---|---|---|---|---|
| m/z | Intensity | m/z | Intensity | ||||||||
|
|
585.9865 | 5 | ||||||||
|
|
586.4878 | 11 | ||||||||
| 586.8460 | 12 | 586.8460 | 12 | ||||||||
|
|
587.5647 | 1387 | ||||||||
|
|
587.9848 | 8 | ||||||||
|
|
588.5594 | 520 | ||||||||
|
|
588.8850 | 12 | ||||||||
Once the list of ions has been imported into the program, the precursor ion may optionally be removed (if present). The mass of the precursor ion to search for and mass window (tolerance) to match it are specified in the Ion Match Options frame of the Peptide Sequence Fragmentation Modelling window.
The ion list is next normalized to keep only the most intense ions and to allow a match score to be computed when matching ions. Normalization involves first sorting the list by decreasing intensity and only keeping the top-most ions (defined by Number of Ions to Use). Next, the list of ions actually being used is subdivided into mass regions (typically 10 regions). The ions in each mass region are normalized to the most intense ion in the given region, and all ions are normalized to a uniform maximum value, typically 100. Normalization parameters can be modified using the Ion Match List Options window
The following table illustrates a raw ion list, the list after choosing just the top 10 ions, and the list after dividing into 3 regions and normalizing each region. Note that unlike the example table above, this list was not binned.
| Original Data |
Top 10 ions Three Subdivisions |
|||
|---|---|---|---|---|
| m/z | Intensity | m/z | Raw Intensity |
Normalized |
| 585.9116 | 3 | 586.388 | 11 | 0.8 |
| 586.0613 | 5 | 586.846 | 12 | 0.9 |
| 586.388 | 11 | 587.4271 | 1387 | 100 |
| 586.5022 | 1 | 587.7023 | 8 | 100 |
| 586.5732 | 2 | 587.7939 | 6 | 75 |
| 586.846 | 12 | 587.8698 | 6 | 75 |
| 587.4271 | 1387 | 588.2092 | 8 | 100 |
| 587.7023 | 8 | 588.4289 | 520 | 100 |
| 587.7939 | 6 | 588.6898 | 10 | 1.9 |
| 587.8698 | 6 | 588.993 | 12 | 2.3 |
| 588.0663 | 5 | |||
| 588.2092 | 8 | |||
| 588.4289 | 520 | |||
| 588.6898 | 10 | |||
| 588.7769 | 6 | |||
| 588.993 | 12 | |||
When normalization is complete, the ion masses remaining in the ion list are compared to the masses predicted for the fragmentation products of the peptide chain. If a match is found within the specified tolerance, then the ion is highlighted both in the peptide fragmentation table and in the ion matching list. The following table explains the colors used for highlighting ions.
| Color | Explanation |
|---|---|
| Cyan | The ion is present (within tolerance) in both the ion match list and the predicted fragmentation ion table. |
| Yellow | The ion in the match list was matched to a shoulder ion in the predicted fragmentation ion table. |
| Light Red | An ion was present at 110, 120, or 136 m/z in the match list with a normalized score of 40% of the max or greater, but histidine, phenylalanine, or tyrosine was not one of the residues in the peptide chain. See the discussion on rho (ρ) in the scoring algorithm below. |
Ion match statistics are provided, including the number of ions loaded, the number remaining after binning (if applicable), the number within tolerance, whether or not the precursor was found and removed, and the number of matching ions.
A match score is also computed. The higher the score, the better the match. The matching score was modeled after the score used in the Sequest search algorithm developed by John Yates and Jimmy Eng (United States Patent 5,538,897; July 23, 1996). The match score was developed to provide a means for comparing the quality of match of potential peptide sequences against a given mass spectrum. The score is included in this program to allow you to compare the quality of a match for various spectra you might manually inspect using the fragmentation modelling routine. This program is not meant as a replacement for Sequest and will not automatically search a database to find the best matching sequence for a given spectrum.
In order to make the match score more meaningful, the predicted fragmentation ions are assigned arbitrary intensities based on the ion type. The default values are 50 counts for the b and y ions, 10 counts for the a ions, and 10 counts for any neutral losses selected. In addition, shoulder ions can be added for the b and y ions. Shoulder ions are simply ions added at ±1 Da for each b or y ion, since actual data often contains shoulder ions around the b and y ion peaks. An intensity of 25 counts is assigned to shoulder ions. The default intensities can be modified using the Ion Match List Options window.
The equation for computing the match score, Sp, is:
Sp =(Σ im) × ni × (1+β) × (1+ρ) ÷ nτ
In the equation im is the sum of the intensities of each of the matches and (ni) is the count of the matches. 1+β is a correction factor to increase the score when successive y or b ions are found. β is initially zero, but is increased by 0.075 for each sequential y ion and each sequential b ion matched. Similarly, ρ is a correction factor to increase or decrease the score for the occurrence of certain immonium ions. The immonium ions of histidine (110), phenylalanine (120), and tyrosine (136) are commonly observed in fragmentation spectra. These ions are searched for in the normalized ion list, and if a match is found and its intensity is 40% or greater of the maximum intensity, then the given peptide chain is examined to look for the corresponding residue.
For example, if an ion at 120 m/z has an intensity of 60 out of a maximum of 100, then the peptide sequence is examined. If phenylalanine (Phe or F) is present, then rho is increased by 0.15 If Phe is not found, then rho is decreased by 0.15 If the 120 m/z ion was not found, rho is left unchanged. Following this procedure, rho can range anywher from -0.45 to 0.45 Note, that in the original patent the equation used (1-ρ) rathen than (1+ρ). I believe this to be an error since one would want a higher match score if the immonium ion is found and is present in the sequence of interest. The following table illustrates how a sample sequence would be scored.
|
|
|||||||||||||||||||||||||||||||||||||||||||||||||||||||||||||||||||||||||||||||||||||||
|
Computation of score, parsing left to right, top to bottom; a ions are 10 counts, b and y are 50 counts, b/y shoulders are 25, neutral loss ions are 10 counts Σ im = a + b + b* + y + y* + b + y + y* + y ni = 9 β = 0.075 + 0.075 = 0.15 ρ = 0.15 nτ = 20 Sp = 265 × 9 × (1 + 0.15) × (1 + 0.15) ÷ 20 = 157.7 |
The predicted masses from fragmentation of the peptide sequence may be plotted by choosing View | Predicted mass spectrum. If a list of ions to match is present, those ions will also be plotted. If "Update Spectrum on Change" is enabled (Tools menu) then any changes to the loaded ions or predicted fragmentation ions will cause the plot to be updated. For more information, see the Ion Plot Window
The Alignent Offset value can be used to shift the m/z value of all of the ions in the match list to correct for a slightly miscalibrated instrument or to account for a post-translational modification that has changed the overall mass of the peptide whose ions are in the match list. In addition to manually entering an offset value, you can have the program automatically search for the offset value that gives the best match score by choosing Tools | Automatically align Ions to Match.
This process involves incrementing through all of the possible alignment values over a given range with a given increment value. For example, if you enter a maximum offset of 20 and an offset increment of 0.1, the program will test 400 different offset values ranging from -20 to 20 to see which one gives the best match score. If one or more sequential offset values give the same match score, the average of the offset values is kept. For example, if 0.6, 0.7, and 0.8 all give a match score of 423, then offset value displayed when completed is 0.7 A progress indicator is shown which displays the time elapsed and the estimated time to completion. In addition, the current offset value being tested is displayed, along with the statistics for the best matching offset value (not shown until the process is completed, or aborted by pressing escape).
Back to the Molecular Weight Calculator download page